Friday, December 21, 2018

Holiday Office Hours


The Pathways Advisory Group, Inc. office will be closed for 
the following holidays:

Monday, December 24th, 2018 
Tuesday, December 25th, 2018 
Closed at Noon - Monday, December 31st, 2018
Tuesday, January 1st, 2019 
Monday, January 21st, 2019
Monday, February 18th, 2019
Friday, April 19th, 2019
Monday, May 27th, 2019
Thursday, July 4th, 2019
Monday, September 2nd, 2019


In case of an emergency, 
please contact Schwab directly at 1(800) 435-4000.

Happy Holidays!

Find Pathways on

Wednesday, December 19, 2018

It's Dividend Season!


Pathways Advisory Group, Inc.
Evon Mendrin, CFP®


If you’re investing in mutual funds, a curious thing tends to happen each quarter. The value of your funds all suddenly dip! What is the cause? A market calamity across every type of investment??

While regular market activity might affect the value too, one key reason for the dip in prices is the dividend. Mutual funds hold a bunch of stocks, bonds, and other investments. These stocks may pay dividends and the bonds interest. To avoid paying taxes on this income themselves, mutual funds are required to pass them on to you, the shareholder. This can be done annually, but often each quarter. You may see larger capital gain distributions at the end of the year as well.

That’s a good thing, right? Sure, you are able to benefit from the cash flow of the many stocks and bonds you are invested in. However, it does something funny to the price. Each quarter, mutual funds that pay dividends will reduce their share prices by the same amount of the dividend being paid out. This happens on the “ex-dividend” date, the first date you can buy the mutual fund but not have a right to receive that quarter’s dividend.

For example, let’s say XYZ Stock Fund has a current price of $10.00 per share. The fund is set to pay a $0.10 per share dividend on Friday. So, on Thursday, the “ex-dividend” date, the price will drop by the same amount to $9.90 per share. 

This makes sense – why pay the same price to buy an investment, but not have a right to the dividend everyone else is getting? So, the price adjusts accordingly. And you, the current owner, still end up the same financially. Your fund goes down $0.10, but you get a $0.10 cash dividend.

Why now? It’s now that time of year! In fact, the 17th and 18th of this month marked the “ex-dividend” date for many of the mutual fund we invest in. We hope this post sheds some light on the change in prices.

Happy Dividend Season and Happy Holidays!

Find Evon on


Friday, October 26, 2018

Donating Required Traditional IRA Distributions

Pathways Advisory Group, Inc.
      Dustin J. Smith, CFP®


As many of you know, you are required to take taxable distributions from your Traditional IRA once you attain the age of 70½.  Those of you that have experienced this firsthand likely experienced a subsequent uptick in state and federal tax due.  However, as touched on in 2016, donating these required Traditional IRA distributions directly to a charity (otherwise known as a Qualified Charitable Distribution (or QCD) can help mitigate this uptick in taxation. 

Why revisit QCDs now?  

The Tax Cuts and Jobs Act (enacted late last year) made them more attractive.  The fact that taxpayers can take the greater of their itemized deductions or the standard deduction has not changed, but a near doubling of the standard deduction (along with the end of miscellaneous deductions and a new limit for state and local taxes of $10,000), means that more taxpayers will take the standard deduction in the future. 

How will more standard deduction taxpayers make QCDs more attractive?  

Charitable giving has been one of the more popular itemized deductions in the tax code.  Once Standard Deduction taxpayers realize there is no longer a material tax benefit from their itemized giving, they will look for alternatives.  

If you take the standard deduction and also happen to have a required Traditional IRA distribution, donating the required distribution (or any portion of it) directly to a charity (instead of writing a check yourself) effectively makes the contribution deductible again.

How do QCDs work again?  

Required Traditional IRA distributions, up to $100,000, can be given directly to a qualified charity without incurring any tax due.  It’s tax-free money to the charity and a non-taxable distribution for the taxpayer, yet still satisfies the taxpayer’s distribution requirement (or a portion of it). Although it’s not technically reported as a deduction, avoiding taxation on the required distribution is effectively the same thing.  

QCDs have been around since 2006 but they will be much more prevalent now.  For standard deduction taxpayers with required distributions from a Traditional IRA, it’s time to consider switching all charitable giving to direct gifts from a Traditional IRA.  

Dustin J. Smith, CFP®


The above explanation is summarized. It is not all inclusive. Please confirm all specifics with your tax professional. For a more detailed summary of the 2018 Tax Laws alluded to above take a look at this post from January.

Find Dustin on

Friday, October 12, 2018

Perspective During "Turmoil"


Pathways Advisory Group, Inc.
      Evon Mendrin, CFP®


Well, that escalated quickly.

If you’ve been anywhere near the news this week, you’ve likely been made aware of the most recent “End of the World As We Know It.” Stocks had a rough day at the office, and globally we saw quite the decline. How bad was it? Well, if you do a quick Google search of “stocks” and “bloodbath”, you can find more articles than you’d like explaining how the sky is falling, such as:
  •          “Traders are betting that the global market bloodbath…”
  •          “Wall Street Bloodbath Paints Tech and Media Stocks Red”
  •          “Australian stock market plummets after bloodbath on Wall Street…” 
  •          And of course, to help you get through the chaos – “5 Ultra-Safe Stocks to Survive the Wall Street Bloodbath”
It’s times like these when writers dust off the thesaurus, as you can find a medley of doomsday words thrown about, like “plummeting,” “chaos,” “turmoil,” “turbulence.”

To add to it, the financial news is sure to inform us that the Dow Jones Industrial Average faced the third-worst points decline in history, having dropped about 832 points. It’s enough to convince you the end is here and there’s no going back. But what does that really mean? Are we really seeing such a historically devastating event?

When looked at through the proper historical perspective, we see that the day’s drop in the Dow Jones was hardly a devastating event. It’s easy to view dramatic events through a microscope, looking only through a narrow lens. But what if we change lenses, zooming out with for a wider perspective?

Let’s go one lens wider. 832 points may be the third-highest point drop, but as a percentage, it was only roughly 3.1%. That’s hardly historically devastating. For perspective, the 20th largest historical percentage drop in the Dow Jones was 7.07% (7/20/1933). The largest ever? 23.52% (12/12/1914). A 3% dip is a drop (no pun intended) in the bucket compared to that.

Data from us.spindices.com (10/11/2018)


Interestingly, that huge drop was only 16.8 points.  Using a points drop isn’t a helpful reference when the value of the Dow Jones is so much higher than the past. In 1980, the Dow as a whole was only worth around 850 points! The index is currently valued at around 25,000. As Dustin wrote about before, “the Dow just ain’t what it used to be.” Long-term, despite the headlines, the stock market continues its march.

What about the performance of stocks for the year? Through this lens, the Dow Jones Industrial Average is actually positive for this year – just over 3%year-to-date. So is the S&P 500, a popular measure of large-cap US stocks, gaining just over 4%. US stocks as a whole are positive for the year, as the Russell 3000 index is up about 3%. Sure takes the sting out of one day’s news. 

With the widest lens of historical perspective, we also see a decline like this is actually typical. Par for the course. Over the last 38 years, the S&P 500 has had positive returns in 29 years (76%). However, we see an average decline within each year of 13.8%. If we go back to 1946, we see similar results. That kind of drop, historically, is typical within any given year, and doesn’t tell us much about how the year will end. 

It’s amazing what perspective can do when faced with one day’s dramatic event. Taking a step back gives us the opportunity to evaluate what’s really going on and not overreact. Where do stocks go from here? Impossible to say. Trying to predict where the stock market goes in the short-term is a fool’s errand. Should we rush to action? Despite the “chaos” you see, nope. Try to tune out the noise, keep a long-term perspective, and continue with the long-term investment plan you’ve had all along.

Note: All returns data are as of writing, 10/11/2018. The data may have changed as of the time you read this

Find Evon on

Other Posts you might like:


Friday, September 28, 2018

Credit Freezes Are Now Free!

Pathways Advisory Group


Just over a year ago, Equifax experienced a data breach affecting the private information of over 140 million people.  In a blog post responding to the breach, we highlighted a few ways to protect yourself from potential use of your information. One of the most useful methods is placing a freeze on your credit. A freeze restricts access to your credit file, minimizing the risk of new credit being established with your identity. One of the drawbacks of a freeze, however, was the fee required to not only initially apply the freeze but also each time you lifted and reapplied it.

One year later, thanks to a new federal law, we have a remedy for that pesky fee. Starting September 21st, credit freezes (and unfreezes) are now free of cost! You can now apply or lift a freeze with all three of the nationwide credit reporting agencies – Equifax, Experian, and TransUnion without the unnecessary charges . This can be done by mail, by phone, or online. Once established, a freeze can be lifted entirely, for a period of time, or to provide access to a specific entity.

In addition, if you’ve applied a fraud alert to your credit file, they are now extended to one year instead of 90 days. They are still free, and victims of identity theft can still get an extended alert for seven years.

With all of the risks we seem to face when it comes to protecting our identity, it’s good to know one helpful tool was made a lot easier to use.  


Find Pathways On


Other Posts you might like:

Friday, August 10, 2018

Keeping Clients' Rebates and Knowing Your Advisor


Pathways Advisory Group, Inc.
Jeff Karst, CFP®


A news story earlier this year brought to light that Wells Fargo was keeping mutual fund fee rebates rather than distributing those rebates back to the clients.  Well Fargo managed the investment portfolio for a pension fund.  Some of the mutual funds have a revenue sharing feature that would kick a rebate back to Wells Fargo.  Those rebates were supposed to go back to the pension fund but Wells Fargo kept them.

The story might cause some people to wonder if they’re missing out on their own fee rebates. 

This is yet another story highlighting the importance of knowing about the advisors you hire. Pathways is a fee-only investment advisor and financial planning firm.  We are paid solely by our clients.  We do not receive kick-backs, rebates, etc. from any of the mutual funds that we use or from our primary custodian, Charles Schwab.

We primarily (almost exclusively) use the mutual fund company Dimensional Fund Advisors (DFA).  It is simply a match-up in investment philosophy and beliefs.  We believe they do an excellent job of applying academic research to real-world investing in a cost-effective manner.

What can you do to protect yourself and have a better understanding of your advisors? Asking your current or prospective advisors the following questions might be a good way to start:
  • How do you get paid? Only by your clients, or is there compensation from third-parties? The advisor should be able to answer clearly and with full disclosure.

  • Do you act as a fiduciary? Meaning, are you required by law to put the interests of your clients above your own?

  • Do you have a certification or designation, such as the CFP® certification, that holds you to high ethical and competency standards?

You might also find the Searching For an Advisor page on our website helpful. We wish the best for your financial planning through the rest of 2018 and beyond!

Find Jeff On


Other Posts you might like:

Monday, May 21, 2018

Tax Form 5498

Have you received a tax form in the mail recently? If you did just receive a 2017 IRS Tax Form 5498, don't panic. Form 5498 is generated by investment custodians every May for Traditional IRAs, Roth IRAs or Educational Savings Accounts with activity during the previous tax year and usually does not lead to an amended tax filing.

Tax Form 5498 is informational. The IRS reconciles this activity with your Tax Return. If you received this form, ask yourself: Did I contribute to a Roth or Traditional IRA last year? Did I roll money into an IRA last year? Did I contribute or initiate activity out of an Educational Savings Account last year? Did I convert IRA money to a Roth IRA last year? If any of this activity applies to you, you received Form 5498.

Contribution information is typically requested on an accountant's questionnaire. IRA rollovers and conversions generate a 1099-R. Either way, your accountant should already be aware of the activity. Then what should I do with my copy? In most cases, simply add it to your freshly started tax folder for 2018. As your accountant reviews next year's tax file, he or she can confirm that the activity was addressed.

The above explanation is summarized and generic. Please consult your tax professional with any specific questions.

Find Pathways on


You may also like these Posts:

Thursday, May 3, 2018

Is Your Knowledge Expiring?

Pathways Advisory Group, Inc.
      Evon Mendrin, CFP®


How much of what you read today will you still care about a year from now?

I was lucky enough to stumble upon a blog post by Morgan Housel of Collaborative Fund that proposed that very question.  In the post, “Expiring vs. Long-Term Knowledge,” he challenges us to consider: what is the quality of all the stuff we read, and how much does it really benefit us?

With access to the internet, television, and radio, we are flooded with information. Media content is chopped down into bite-sized portions so we can consume more and more. Newsfeeds constantly update us on every bit of information, on any topic we want. How much of that content will you care about years from now?

Citing an observation by MIT’s endowment fund, Housel describes two types of knowledge: expiring knowledge, which has no long-term value, and long-term knowledge, which is valuable over time. He lays out the differences:

“Expiring knowledge catches more attention than it should, for two reasons. One, there’s a lot of it, eager to buzz our short attention spans. Two, we chase it down, anxious to squeeze out insight before it loses relevance.

Long-term knowledge is harder to notice because it’s buried in books rather than blasted in headlines. But its benefit is huge. It’s not just that long-term knowledge rarely expires, letting you accumulate it over time. It’s that compounds over time. Expiring knowledge tells you what happened; long-term knowledge tells you why something happened and is likely to happen again. That “why” can translate and interact with stuff you know about other topics, which is where the compounding comes in.”

There’s an abundance of expiring knowledge! I count four applications on my cell phone alone dedicated to giving me short-term, mostly useless content. What does this information really teach that I can use far into the future? Sadly, not much.

Contrast that to the truly useful information buried in books, research papers, journals, and podcasts. Consider some of the greatest books to have been written – knowledge to have stood the test of time. Consider Benjamin Graham’s The Intelligent Investor (originally written in 1934), Nick Murray’s SimpleWealth, Inevitable Wealth (Published 1999), Dale Carnegie’s How to Win Friends and Influence People(1936), Robert B. Cialdini’s Influence (1984) and Michael Gerber’s The E-Myth (1986).

The advice and knowledge within these books are still as relevant today as they were when first published – and those are on business and finance alone! Not to mention subjects such as history, construction, engineering, automobiles, music, faith, art, and science.

Many of us may not remember the newspaper articles we read in 2011, but – like Housel, we may remember details of great books we read in 2011 and how it affected our thinking.

Even some of the greatest entrepreneurs of our time attribute their success to reading good content. Warren Buffett once remarked, “Read 500 pages like this every day. That’s how knowledge works. It builds up, like compound interest. All of you can do it, but I guarantee not many of you will do it.”

As Housel writes, it’s not just that long-term knowledge rarely expires, but that it compounds! It begins to spread into other areas in your life! Skills you learn from one piece of writing can carry over to other hobbies or work. Long-term knowledge gives you the deeper why’s, what’s and how’s. It helps to sort through the expiring stuff, to know what to pay attention to and what to ignore.  In the same way, relying on short-term knowledge for decision making can compound in your life as well.

Investing is a great example – the hottest market headlines are always fighting for attention, and yesterday’s headlines are forgotten. Even data from companies – such as quarterly earnings, performance, expenses, and cash flow – expire in short-term value once the next quarter comes.

These bits of information compete against long-term research and discipline. How easy it is to make quick, emotional decisions from an article we’ve read – forgetting about the long-term plans we’ve established.

So, what are we to do? Housel writes:

“I try to ask when I’m reading: Will I care about this a year from now? Ten years from now? Eighty years from now?

It’s fine if the answer is ‘no,’ even a lot of the time. But if you’re honest with yourself you may begin to steer toward the enduring bits of knowledge.”

As for me, I think I’ll go ahead and blow the dust off the stack of books I’ve been neglecting. News on the latest Donald Trump tweets will have to wait.

-Written by Evon Mendrin from our June 2017 Client Newsletter Article.

Find Pathways on 


Other Posts you might like:

Friday, April 6, 2018

Now and Then Story – Does It Sound Familiar?

Pathways Advisory Group, Inc.
      Dustin J. Smith, CFP®


We are in the peace-of-mind business.  This is one of the reasons we focus more heavily on knowledge and expectations than short-term results.  We would all like returns to be predictable and consistent, but this expectation is unrealistic and unfounded.  The actual results tell a much different story. 

Big Bang Theory Executive producer Dave Goetsch realized this through his own investing experience. He felt true stress and anxiety during the Great Recession, but understanding and accepting the unpredictable nature of markets completely changed the way he viewed recent results.  

Long-term optimism doesn’t have to depend on short-term results.  Hopefully, you can relate to the peace-of-mind he shared in a recent Now and Then story. You can read his story by clicking here or by using the link below. Enjoy and have a great weekend!

Dustin J. Smith, CFP®

Find Dustin on
 Dustin Smith LinkedIn


Other Posts you might like:

Friday, March 16, 2018

Thinking of Downsizing Your Home?

Pathways Advisory Group, Inc.
Jeff Karst, CFP®


Have you ever thought about downsizing your home but worry about new property taxes?

A little background


Proposition 13 was passed overwhelmingly by California voters in 1978.  It establishes the tax base when you purchase a property and that base value increases 2% per year.  

Assume you purchased your house in 1987 for $125,000. Your current tax base would be about $230,000 (assuming no re-assessments).  If the home next door sells for $699,000 the new buyer’s property taxes are roughly three times higher than what you pay each year.

It's time to downsize


The kids have long moved away and you’re ready to downsize to a smaller, more manageable home.  Assume your home sells for $699,000 (similar to your neighbor’s) and you purchase a smaller home for $450,000.  You have a smaller, more manageable home that should cost less.  The only problem is your tax base was $230,000, so your property taxes will double.

Or maybe not…


There is a once in a lifetime exemption to retain your property tax base if you downsize your home.  Proposition 60 allows you to transfer your base value when you downsize (the new home costs less than your previous home) within the same county.  

You or your spouse must be over age 55 to apply for the exclusion.  The California Board of Equalization has a page dedicated to Frequently Asked Questions about Proposition 60.

You may not be able to transfer all the trees and shrubs from the old home, but you may be able to transfer the nice, low tax base!

Find Jeff on


Other Posts you might like:

Thursday, March 15, 2018

Tax Time is Here, and Your 1099s Should Be Too!


We have been informed that all Schwab 1099s have been mailed out as of February 28th. Schwab extended their mailing date into February to reduce the number of corrected 1099's, but corrections are still a possibility. The forms should be available online through your Schwab login. Please give our office a call if you have any questions.

Good luck with your taxes, and happy filing!

Find Pathways on


Other Posts you might like:

Friday, February 16, 2018

Recent Volatility and the Headlines You Don’t See!


After a period of relative calm in the markets, the recent increase in volatility has renewed anxiety for many investors.

From February 1–8, the US market (as measured by the Russell 3000 Index1) fell over 8%, resulting in many investors wondering what the future holds and if they should make changes to their portfolios.  Financial news outlets were quick to jump on the commotion, as you’ll find headlines filled with “chaos,” “turmoil,” and “panic.” However, here are a few of the headlines2
you probably didn’t see over the last two weeks.

“Another normal year in the market, as stock prices decline.”

“Recent decline offers little insight about the future.”


It’s natural to worry the sudden volatility was a sign of worse things to come, but a longer-term perspective shows us these types of declines are quite normal.

Exhibit 1 shows calendar year returns for the US stock market since 1979, as well as the largest intra-year declines that occurred during a given year. During this period, the average intra-year decline was about 14%. About half of the years had declines of more than 10%, and around a third had declines of more than 15%.

However, despite substantial intra-year drops, calendar year returns were positive in 32 years out of the 37 examined. As you can see, the recent decline is normal behavior for a functional auction market and tells us very little about the future.


“Market timing isn’t the answer.”

“Investors wisely staying in the game.”


Market prices aggregate the information and expectations of all the thousands of market participants better than we can individually. Information that’s available and the opinions of investors everywhere are built into current prices. If that’s true, stock mispricing can’t be systematically exploited. Meaning, we can’t time market!

This point, supported by the fact that a substantial proportion of stock returns come from just a handful of days, leaves long-term investors with plenty of incentive to remain invested. 

Exhibit 2 helps illustrate this point. It shows the annualized compound return of the S&P 500 Index going back to 1990 and shows the impact of missing out on just a few days of strong returns. 


The bars represent the hypothetical growth of $1,000 over the period and show what happened if you missed the best single day during the period and what happened if you missed a handful of the best single days. The data shows that mistiming or being on the sidelines for the best single days substantially lowered returns for the entire period.

“Savers rejoice as stocks go on sale.”

There wasn’t a whole lot of rejoicing the past few weeks, but should savers really fear these types of market declines? For those regularly contributing to their investments, the short-term volatility will actually aid their long-term returns. How? The assets they want to buy just went on sale! 

Figure 3 shows the historical growth of US Large and Small cap stocks. Since 1926, there have been tremendous amounts of ups and downs. Some were quite serious (Great Depression, the 1973 crash, Dot-Com Bubble, Great Recession). We were reminded these last two weeks that stocks carry risk. Yet long-term results reward disciplined investors, even through all the short-term volatility. So rejoice, savers, and keep saving!


Conclusion

While market volatility can be nerve-racking, reacting emotionally and changing long-term investment strategies can prove harmful. With each new decline, try to look past the noise and remember the headlines that you don’t see.

Video

For more insight, view this video about expected returns before, during and after market declines. Market highs and market declines offer little insight about future expected returns (for the long-term investor).


1Frank Russell Company is the source and owner of the trademarks, service marks, and copyrights related to the Russell Indexes.
2These, of course, aren’t actual headlines. Just simple truths you won’t always see in the papers!

Find us on
or at our Website!


Other Posts you might enjoy:

Saturday, February 3, 2018

Super Bowl Prediction (Go Eagles!)

Evon Mendrin
Pathways Advisory Group, Inc.


The Big Game is just around the corner, and you know what that means - stock market predictions!

Our very own Jeff Karst wrote back in 2012 how successful the Super Bowl has been at predicting how the stock market performs through the rest of the year. The "Super Bowl Indicator" predicts that if the NFC team wins, the S&P 500 will be up for the year. If the AFC team wins, the S&P 500 will decline. Six years later that track record continues with an outstanding 80% success rate! With that kind of success, who needs economists?

However, what that really shows is we can find a connection and correlation between any two things if we really wanted to. Take the Sports Illustrated Swimsuit Issue Indicator or the Men's Underwear Indicator as further examples - we often try to find connections where it's simply pure coincidence.

As Jeff writes, it's silly to base our investments on the results of a football game. The preferred way, he says, is a well-diversified, long-term strategy that relies on the fundamental principal that companies will continue to find ways to be profitable.

But just in case - let's go Eagles!

Find Evon on


Other Posts You might like:

Friday, January 19, 2018

2017 Market Review

Another year goes by, and it’s time for another Market Review. This guest post by Dimensional Fund Advisors' Bryan Harris reviews how global stock markets went against the predictions in 2017 and how difficult it is to guess which countries or asset class will do best in any given year. Ultimately, there is great wisdom in diversifying your investments broadly across countries and types of assets and remaining disciplined for the long term.

Bryan Harris
Dimensional Fund Advisors


At the beginning of 2017, a common view among money managers and analysts was that the financial markets would not repeat their strong returns from 2016. Many cited the uncertain global, economy, political turmoil in the US, implementation of Brexit, conflicts in the Middle East, North Korea’s weapons buildup, and other factors. The global equity markets defied their predictions, with major equity indices in the US, developed ex-US, and emerging markets posting strong returns for the year.

The broad global advance underscores the importance of following an investment approach based on diversification and discipline rather than prediction and timing. Attempting to predict markets requires investors to not only accurately forecast future events, but also predict how markets will react to those events. The 2017 markets were a good reminder that there is little evidence suggesting either of these objectives can be accomplished on a consistent basis.

Instead of attempting to make predictions about future events, investors should appreciate that today’s price reflects the expectations of market participants and information about future expected returns. The following quote by the late Merton Miller, Nobel laureate, describes this view:

“Everybody has some information. The function of the markets is to aggregate that information, evaluate it, and get it incorporated into prices.” —Merton Miller


The chart above highlights some of the year’s prominent headlines in the context of global stock market performance as measured by the MSCI All Country World Index-Investable Market Index (MSCI ACWI IMI). These headlines are not offered to explain market returns. Instead, they serve as a reminder that investors should view daily events from a long-term perspective and avoid making investment decisions based solely on the news.

World Economy

In 2017, the global economy showed signs of stronger growth, with 45 countries tracked by the Organization for Economic Cooperation and Development (OECD) all on pace to expand.1 Economic outlook and the expected impact on future cash flows are among the many variables markets consider when setting prices. Therefore, investors should remember that growth in the economy is not always linked to stock market performance.

2017 Market Perspective


Equity Market Highlights

Global equity markets posted another positive year of returns in 2017. The S&P 500 Index recorded a 21.83% total return and small cap stocks, as measured by the Russell 2000 Index, returned 14.65%, both above their long-term average return of 11.96% and 11.73%, respectively, since 1979.

Returns among non-US equity markets were even higher. The MSCI World ex USA Index, which reflects non-US developed markets, logged a 24.21% return and the MSCI Emerging Markets Index a 37.28% return2, making this the fifth highest return in the index history.

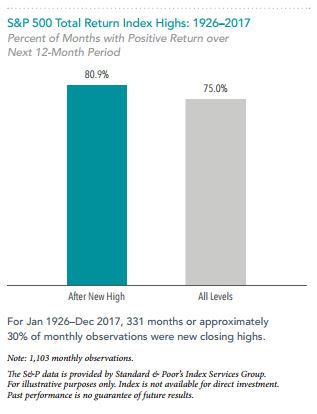
As the S&P 500 and other indices reached all-time highs during the year, a common media question was whether markets were poised for a downturn. History tells us that a market index being at an all-time high generally does not provide actionable information for investors.


For evidence, we can look at the S&P 500 Index for the better part of the last century. From 1926 through 2017, the frequency of positive 12-month returns following a new index high was similar to what is observed following months of any level. In fact, over this time period, almost a third of the monthly observations were new closing highs for the index. The data shows that new index highs have historically not been useful predictors of future returns.3

Global Diversification Impact

Developed ex US markets and emerging markets generally outperformed US equities. As a result, a market cap-weighted global equity portfolio would have outperformed a US equity portfolio.

The S&P 500 Index’s 21.83% return marked its best calendar year since 2013 and placed 2017 in the top third of best performing calendar years in the index’s history. Despite these returns, the US ranked in the bottom half of countries for the year, placing 35th out of the 47 countries in the MSCI All Country World Index (IMI).

Delving into individual countries, country level returns were mostly positive. Using the MSCI All Country World Index (IMI) as a proxy, 45 out of the 47 countries posted positive returns. Country level returns were dispersed even among those with positive returns. In developed markets, returns ranged from +10.36% in Israel to +51.39% in Austria. In emerging markets, returns ranged from –24.75% in Pakistan to +53.56% in Poland—a spread of almost 80%. Without a reliable way to predict which country will deliver the highest returns, this large dispersion in returns between the best and worst performing countries again emphasizes the importance of maintaining a diversified approach when investing globally.

China provides an example highlighting the noise in year-to-year single country returns. After a flat-to-negative return (USD) in 2016, Chinese equities returned more than 50% (USD) in 2017, making China one of the best performing countries for the year.

Currencies

Most major currencies including the euro, the Australian dollar, and the British pound appreciated against the US dollar. The strengthening of non-US currencies had a positive impact on returns for US investors with holdings in unhedged non-US assets. This may surprise some investors given that the US dollar has strengthened against many currencies over the past five- and 10-year periods.
However, just as with individual country returns, there is no reliable way to predict currency movements. Investors should be cautious about trying to time currencies based on the recent good or bad performance of the US dollar or any other currency.

Premium Performance


In 2017, the small cap premium4 was generally positive in developed ex US markets and negative across US and emerging markets. The profitability premium5 was positive across US, developed ex US, and emerging markets, while the value premium6 was negative across those markets.

US Market

In the US, small cap stocks under-performed large cap stocks and value stocks under-performed growth stocks. On a positive note, high profitability stocks outperformed low profitability stocks as measured market wide.

Although US small cap stocks, as described by the Russell 2000 Index, provided a healthy 14.65% return in 2017, the US small cap premium (as measured by the Russell 2000 Index minus the Russell 1000 Index) was negative, ranking in the lowest third of annual return differences since 1979. However, over the 10-year period ending December 31, the small cap premium was positive.

US value stocks returned 13.19% in 2017, as measured by the Russell 3000 Value Index. While double-digit returns from value are appealing, US growth stocks performed even better, with a 29.59% return as represented by Russell 3000 Growth Index. The difference between value and growth returns, as measured by the Russell 3000 Value Index minus Russell 3000 Growth Index, made 2017 the fourth lowest year for value since 1979 and pulled the five-year rolling premium return into negative territory.

Even over extended periods, under-performance of the value premium or any other premium is within expectation and not unusual. Over a 10-year period ending in March 2000, value stocks under-performed growth stocks by 5.61% per year, as measured by the Russell 1000 Value and Russell 1000 Growth indices.

This underperformance quickly reversed course and by the end of February 2001, value stocks had outperformed growth stocks over the previous one-, three-, five-, 10-, and 20-year periods. Premiums can be difficult if not impossible to predict and relative performance can change quickly, reinforcing the need for discipline in pursuing these sources of higher expected returns.

The profitability premium was positive in 2017, with US high profitability stocks outperforming low profitability stocks. Viewing profitability through the lens of the other premiums, high profitability stocks outperformed low among value stocks while underperforming among growth stocks.
The complementary behavior of premiums in 2017 is a good example of the benefits of integrating multiple premiums in an investment strategy, which can increase the reliability of out-performance and mitigate the impact of an individual premium under-performing, as was the case with value among US stocks in 2017.

Developed ex US Markets

In developed ex US markets, small cap stocks outperformed large cap stocks while value stocks under-performed growth stocks. High profitability stocks outperformed low profitability stocks.

Over both five- and 10-year rolling periods, the small cap premium, measured as the MSCI World ex USA Small Cap Index minus the MSCI World ex USA Index, continued to be positive.

Similar to the US equity market, value stocks posted a healthy 21.04% return for 2017 as measured using MSCI World ex USA Value Index. However, growth stocks performed even better with a 27.61% return, as measured by the MSCI World ex USA Growth Index.

The profitability premium was positive in developed ex US markets viewed market wide. Looking within size and style segments of the market, high profitability outperformed low profitability in all but the large growth segment.

Emerging Markets

In emerging markets, small cap stocks under-performed large cap stocks and value stocks under-performed growth stocks. Similar to the US equity market, high profitability stocks outperformed those with low profitability.

Value stocks returned 28.07% as measured by the MSCI Emerging Markets Value Index, but growth stocks fared better returning 46.80% using the MSCI Emerging Markets Growth Index. The value premium, measured as MSCI Emerging Markets Value Index minus MSCI Emerging Markets Growth Index, was the lowest since 1999.

Though 2017 generally marked a positive year for absolute equity returns, it marked a change in premium performance from 2016 when the size and value premiums were generally positive across global markets. Taking a longer-term perspective, these premiums remain persistent over decades and around the globe despite recent years’ headwinds. It is well documented that stocks with higher expected return potential, such as small cap and value stocks, do not realize these returns every year. Maintaining discipline to these parts of the market is the key to effectively pursuing the long-term returns associated with the size, value, and profitability premiums.

Fixed Income

Both US and non-US fixed income markets posted positive returns in 2017. The Bloomberg Barclays US Aggregate Bond Index gained 3.54%. The Bloomberg Barclays Global Aggregate Bond Index (hedged to USD) gained 3.04%.

Yield curves were upwardly sloped in many developed markets for the year, indicating positive expected term premiums. Realized term premiums were indeed positive both globally and in the US as long-term maturities outperformed their shorter-term counterparts.

Credit spreads7, which are the difference between yields on lower quality and higher quality fixed income securities, were relatively narrow during the year, indicating smaller expected credit premiums. Realized credit premiums were positive both globally and in the US, as lower-quality investment-grade corporates outperformed their higher-quality investment-grade counterparts. Corporate bonds were the best performing sector, returning 6.42% in the US and 5.70% globally, as reflected in the Bloomberg Barclays Global Aggregate Bond Index (hedged to USD).

In the US, the yield curve flattened as interest rates increased on the short end and decreased on the long end of the curve. The yield on the 3-month US Treasury bill increased 0.88% to end the year at 1.39%. The yield on the 2-year US Treasury note increased 0.69% to 1.89%. The yield on the 10-year US Treasury note decreased 0.05% for the year to end at 2.40%. The yield on the 30-year US Treasury bond decreased 0.32% to end the year at 2.74%.

In other major markets, interest rates increased in Germany while they were relatively unchanged in the United Kingdom and Japan. Yields on Japanese and German government bonds with maturities as long as eight years finished the year in negative territory.

CONCLUSION


The year of 2017 included numerous examples of the difficulty of predicting the performance of markets, the importance of diversification, and the need to maintain discipline if investors want to effectively pursue the long-term returns the capital markets offer. The following quote by David Booth provides useful perspective as investors head into 2018:


“The key is to have the correct view of markets and how they work. Once you accept this view of markets, the benefits go way beyond just investing money.” 
—David Booth

[1] Wall Street Journal, “Everything Went Right for Markets in 2017—Can That Continue?”, 29 Dec. 2017.
[2] All non-US returns are in USD, net dividends.
[3] Dimensional Fund Advisors, “New Market Highs and Positive Expected Returns,” Issue Brief, 5 Jan. 2017.
[4] The small cap premium is the return difference between small capitalization stocks and large capitalization stocks.
[5] The profitability premium is the return difference between stocks with high relative profitability and stocks with low relative profitability.
[6] The value premium is the return difference between stocks with low relative prices (value) and stocks with high relative prices (growth). 
[7] Bloomberg Barclays Global Aggregate Corporate Option Adjusted Spread.


Source: Dimensional Fund Advisors LP.

Sources:
Frank Russell Company is the source and owner of the trademarks, service marks, and copyrights related to the Russell Indexes. S&P and Dow Jones data © 2018 S&P Dow Jones Indices LLC, a division of S&P Global. All rights reserved. MSCI data © MSCI 2018, all rights reserved. ICE BofAML index data © 2018 ICE Data Indices, LLC. Bloomberg Barclays data provided by Bloomberg. Indices are not available for direct investment; their performance does not reflect the expenses associated with the management of an actual portfolio.
Past performance is no guarantee of future results. This information is provided for educational purposes only and should not be considered investment advice or a solicitation to buy or sell securities. There is no guarantee an investing strategy will be successful. Diversification does not eliminate the risk of market loss.
Investing risks include loss of principal and fluctuating value. Small cap securities are subject to greater volatility than those in other asset categories. International investing involves special risks such as currency fluctuation and political instability. Investing in emerging markets may accentuate these risks. Sector-specific investments can also increase these risks.
Fixed income securities are subject to increased loss of principal during periods of rising interest rates. Fixed income investments are subject to various other risks, including changes in credit quality, liquidity, prepayments, and other factors. REIT risks include changes in real estate values and property taxes, interest rates, cash flow of underlying real estate assets, supply and demand, and the management skill and creditworthiness of the issuer.
Dimensional Fund Advisors LP is an investment advisor registered with the Securities and Exchange Commission.